
Visualizing the ratio of wild mammals to domesticated mammals
Started on April 26, 2025
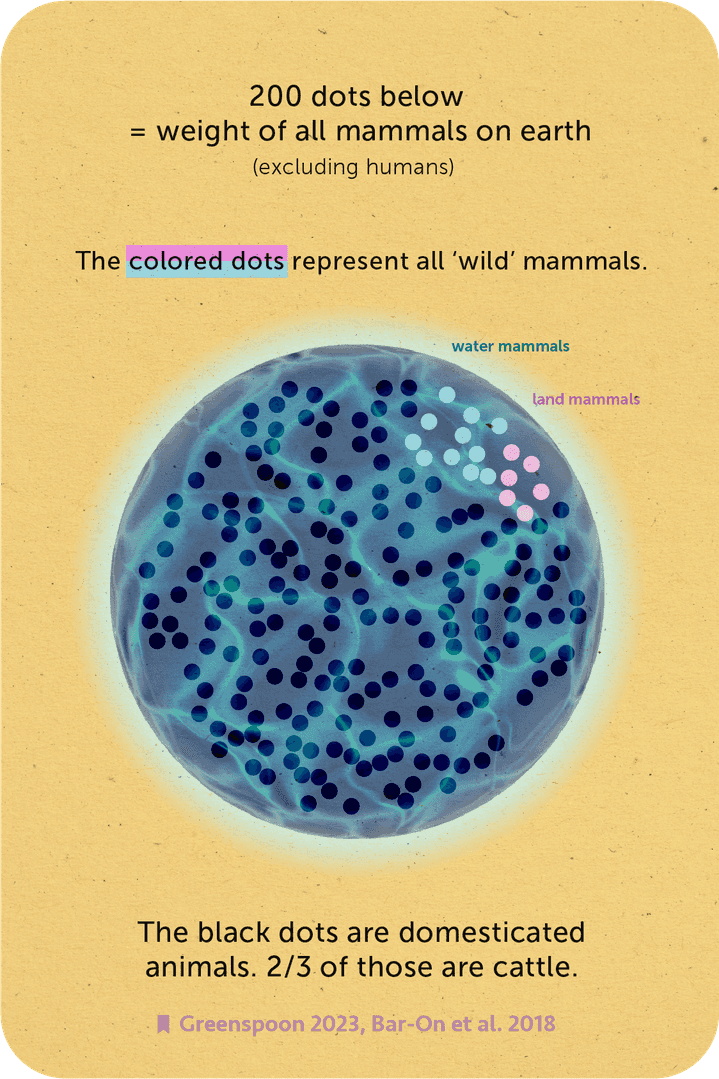
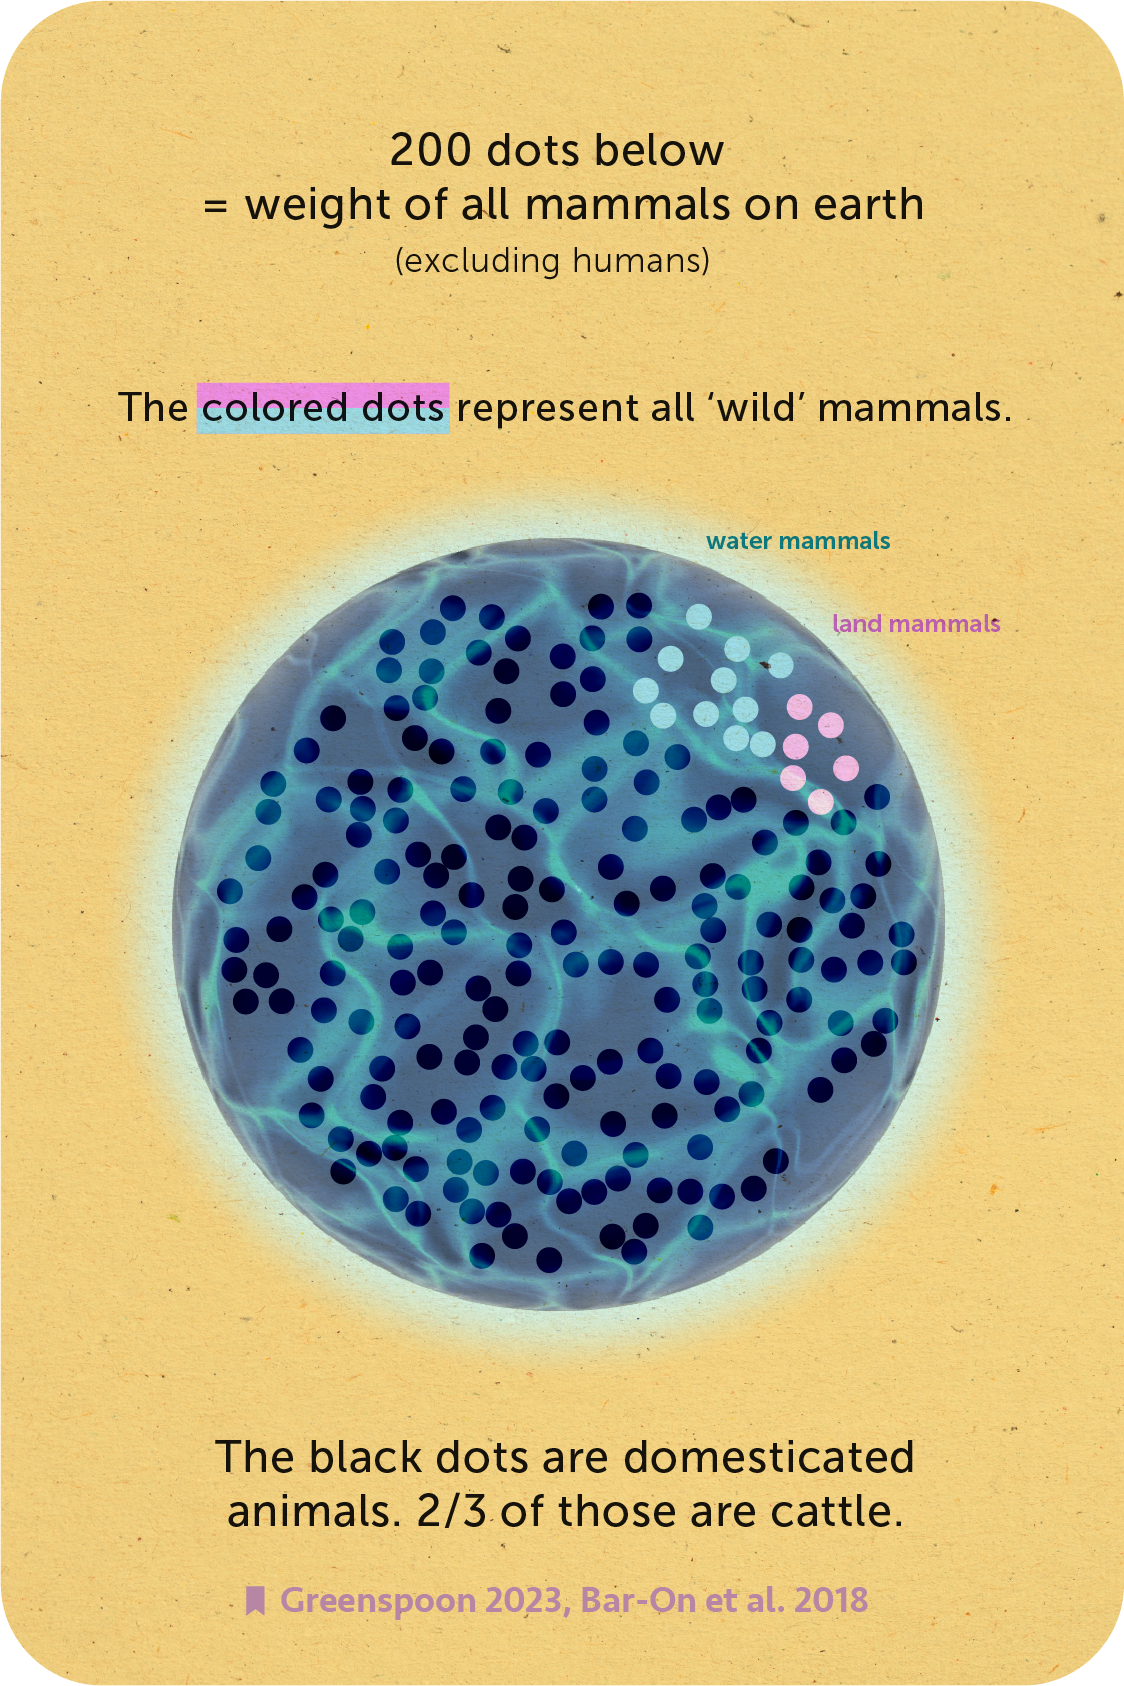
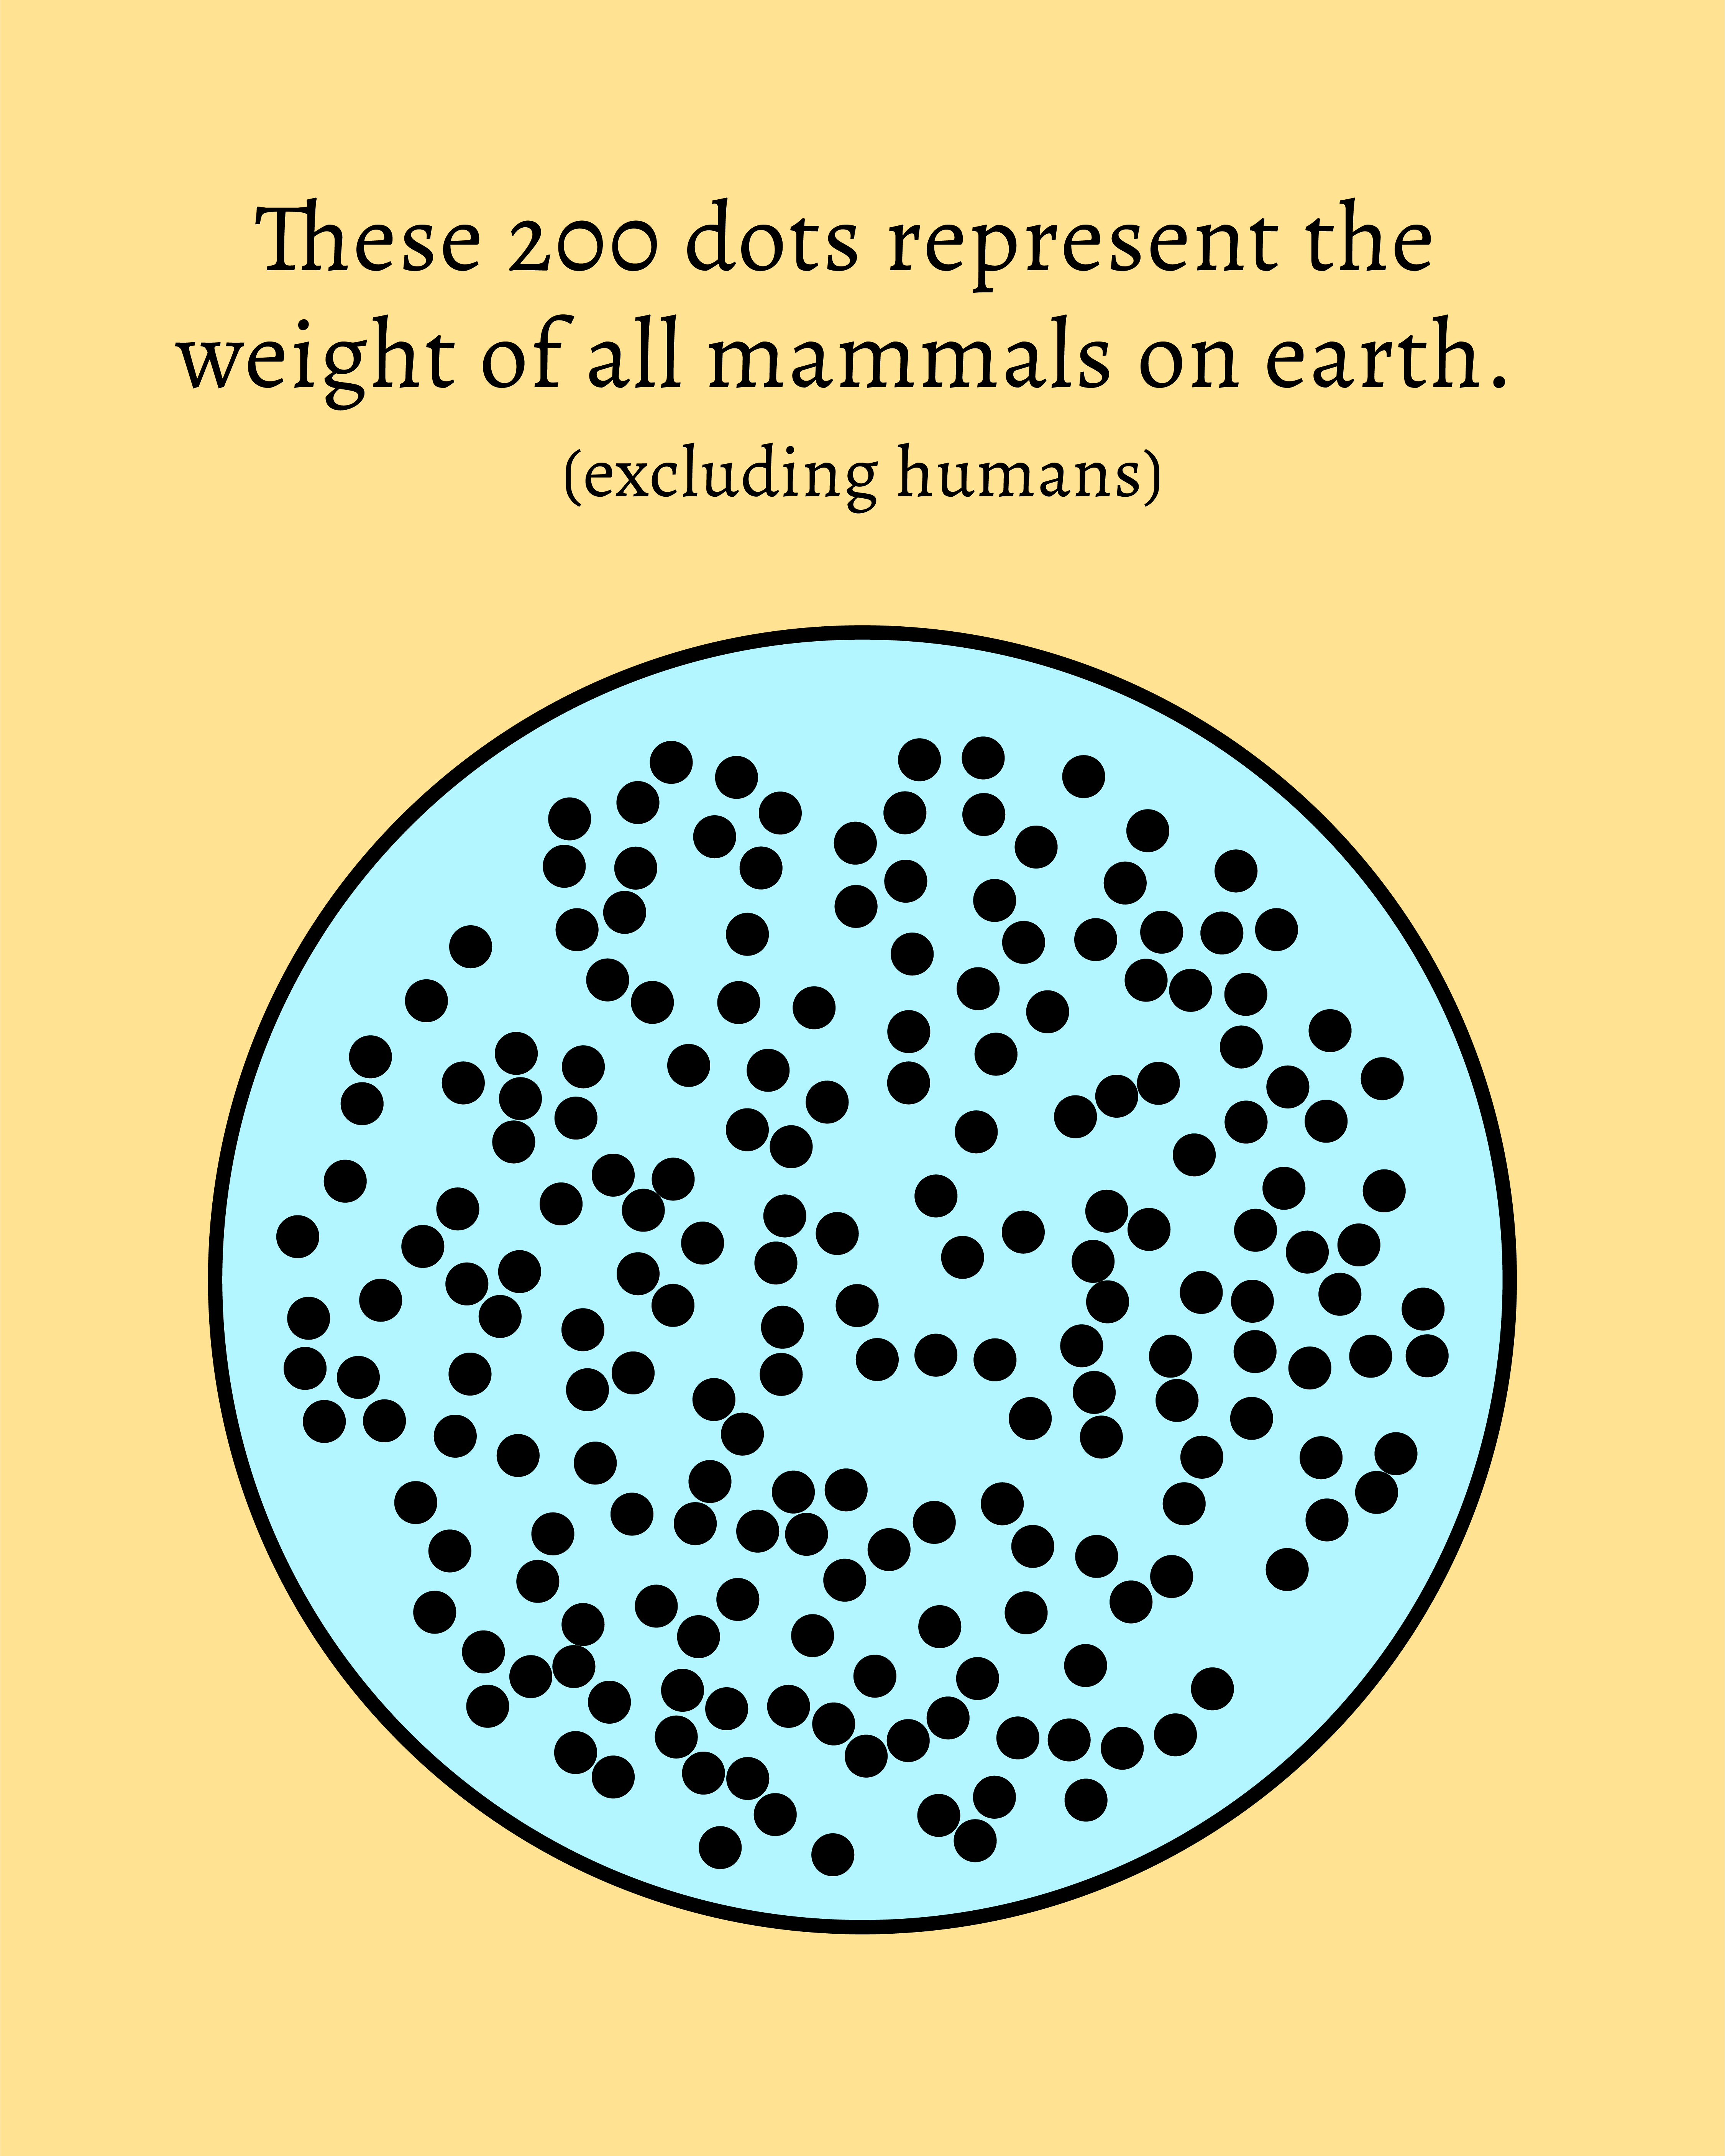
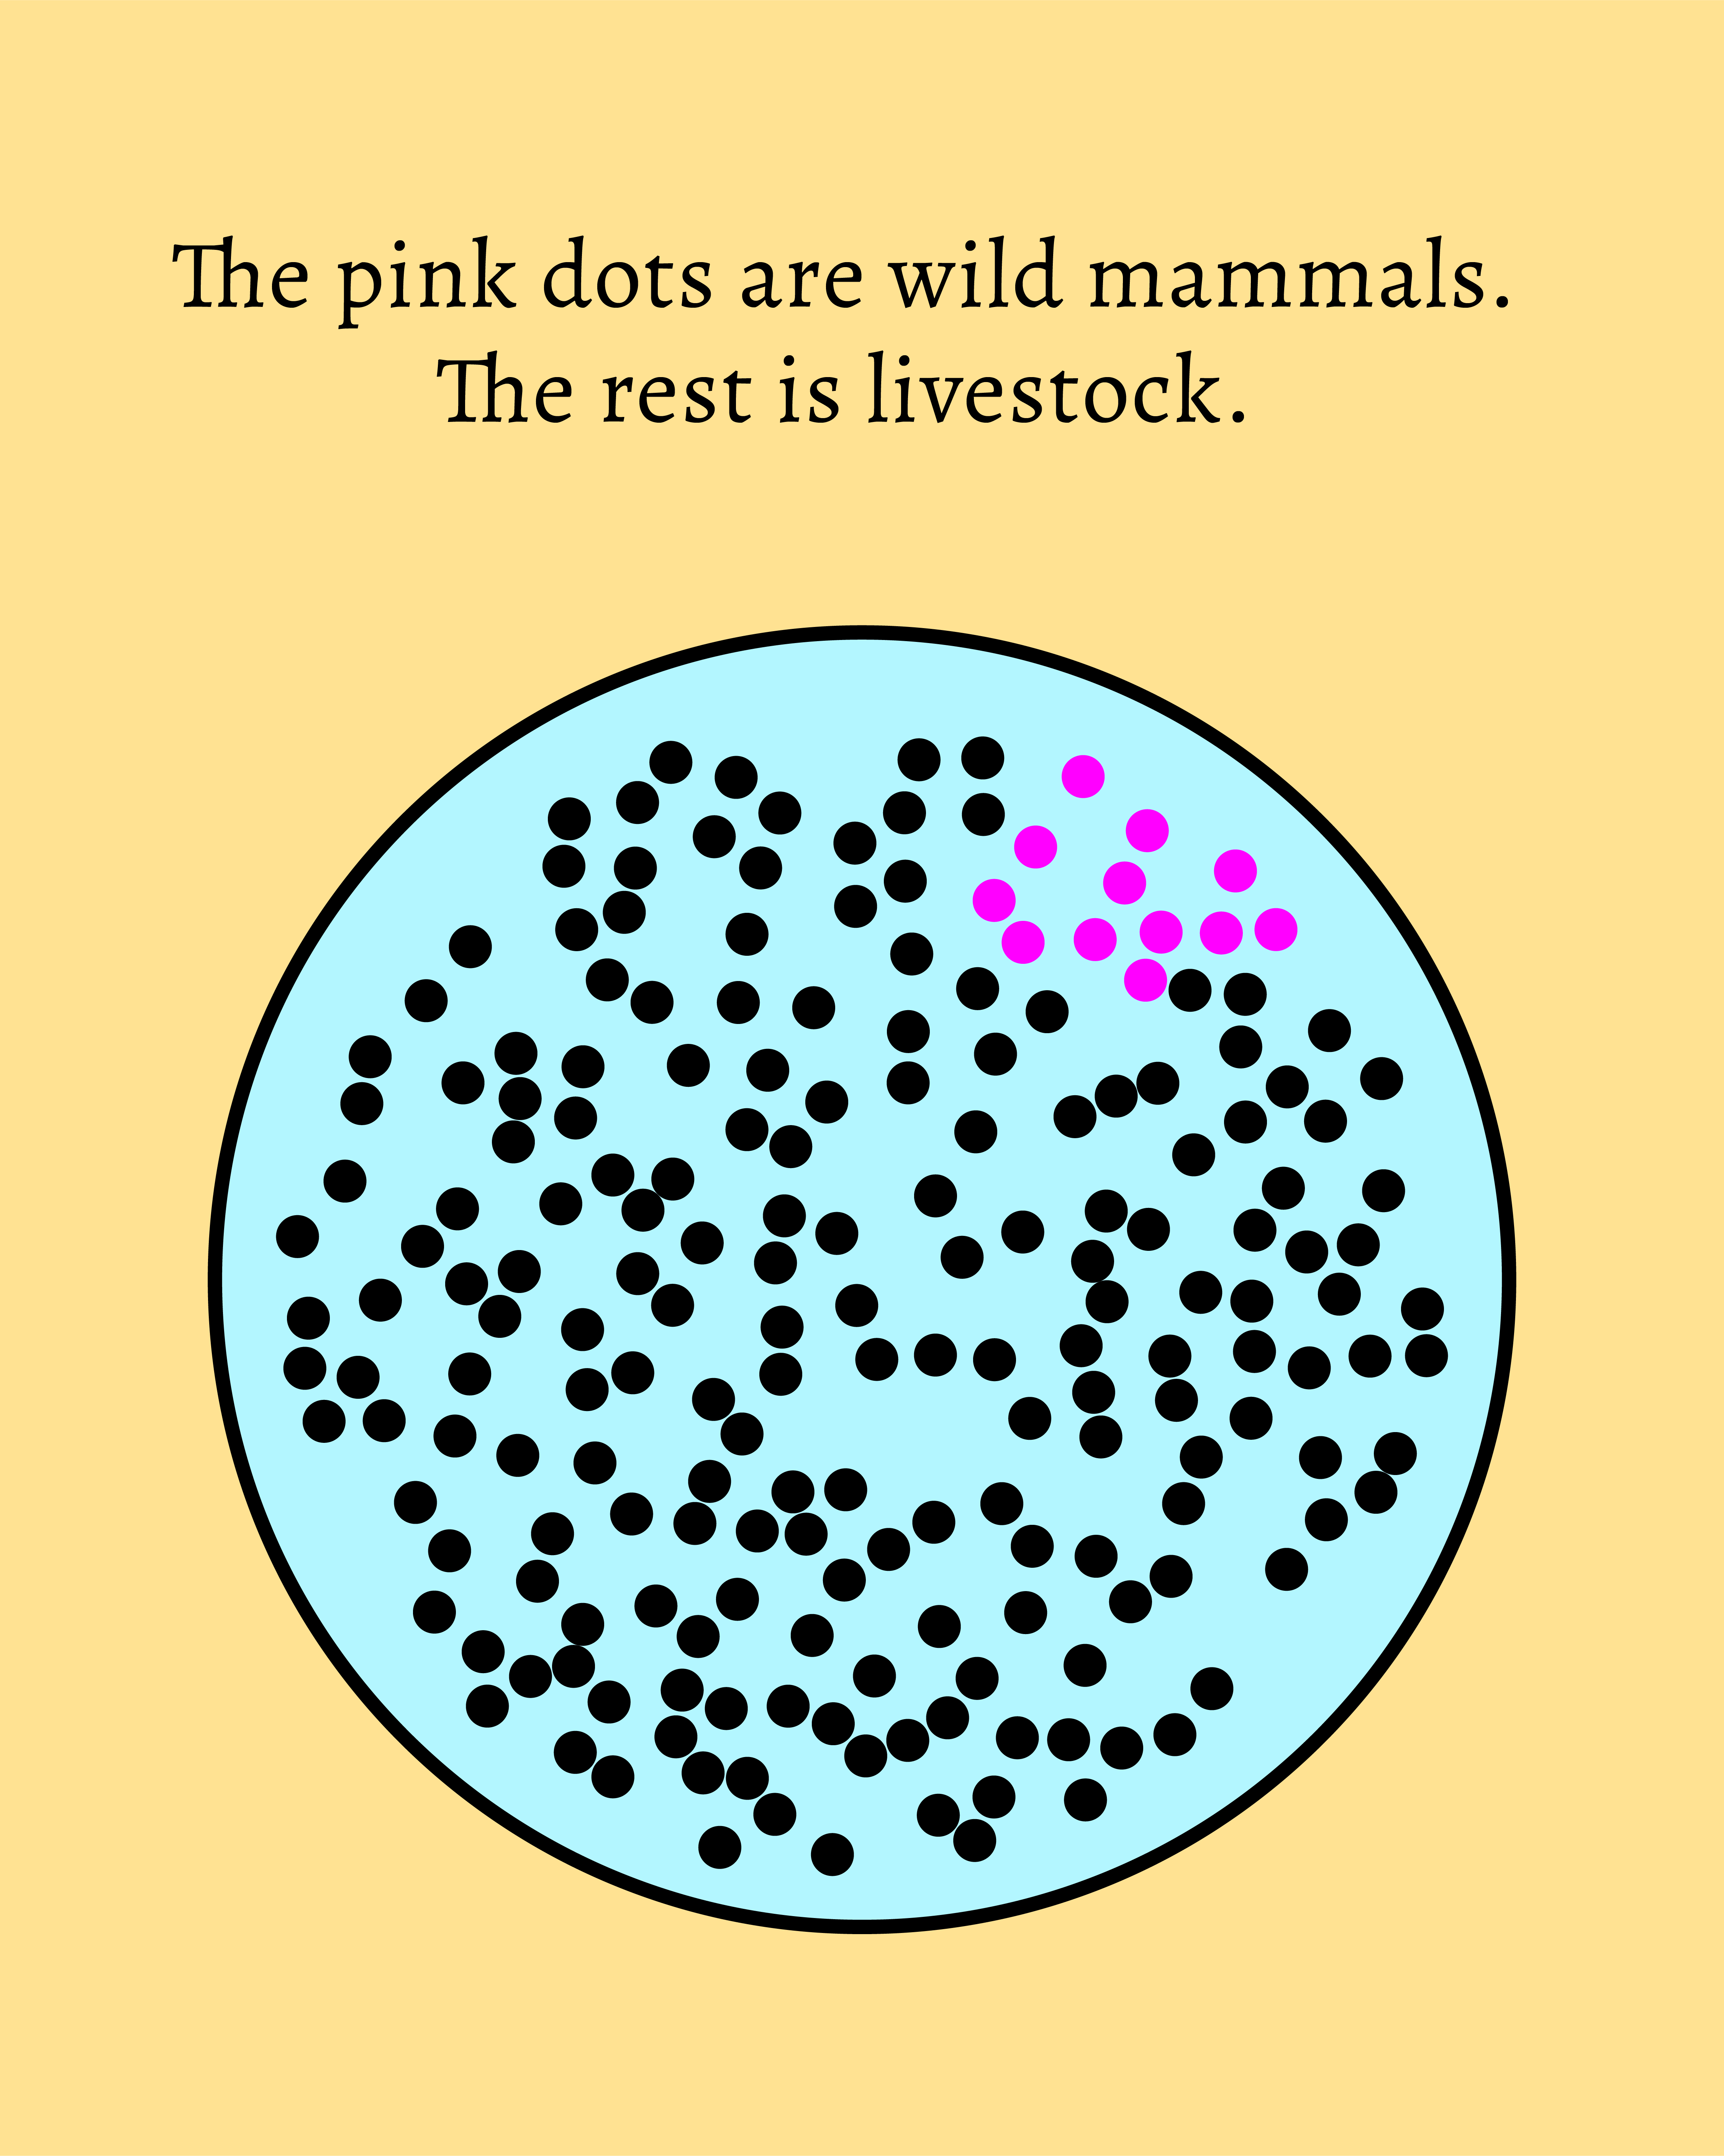
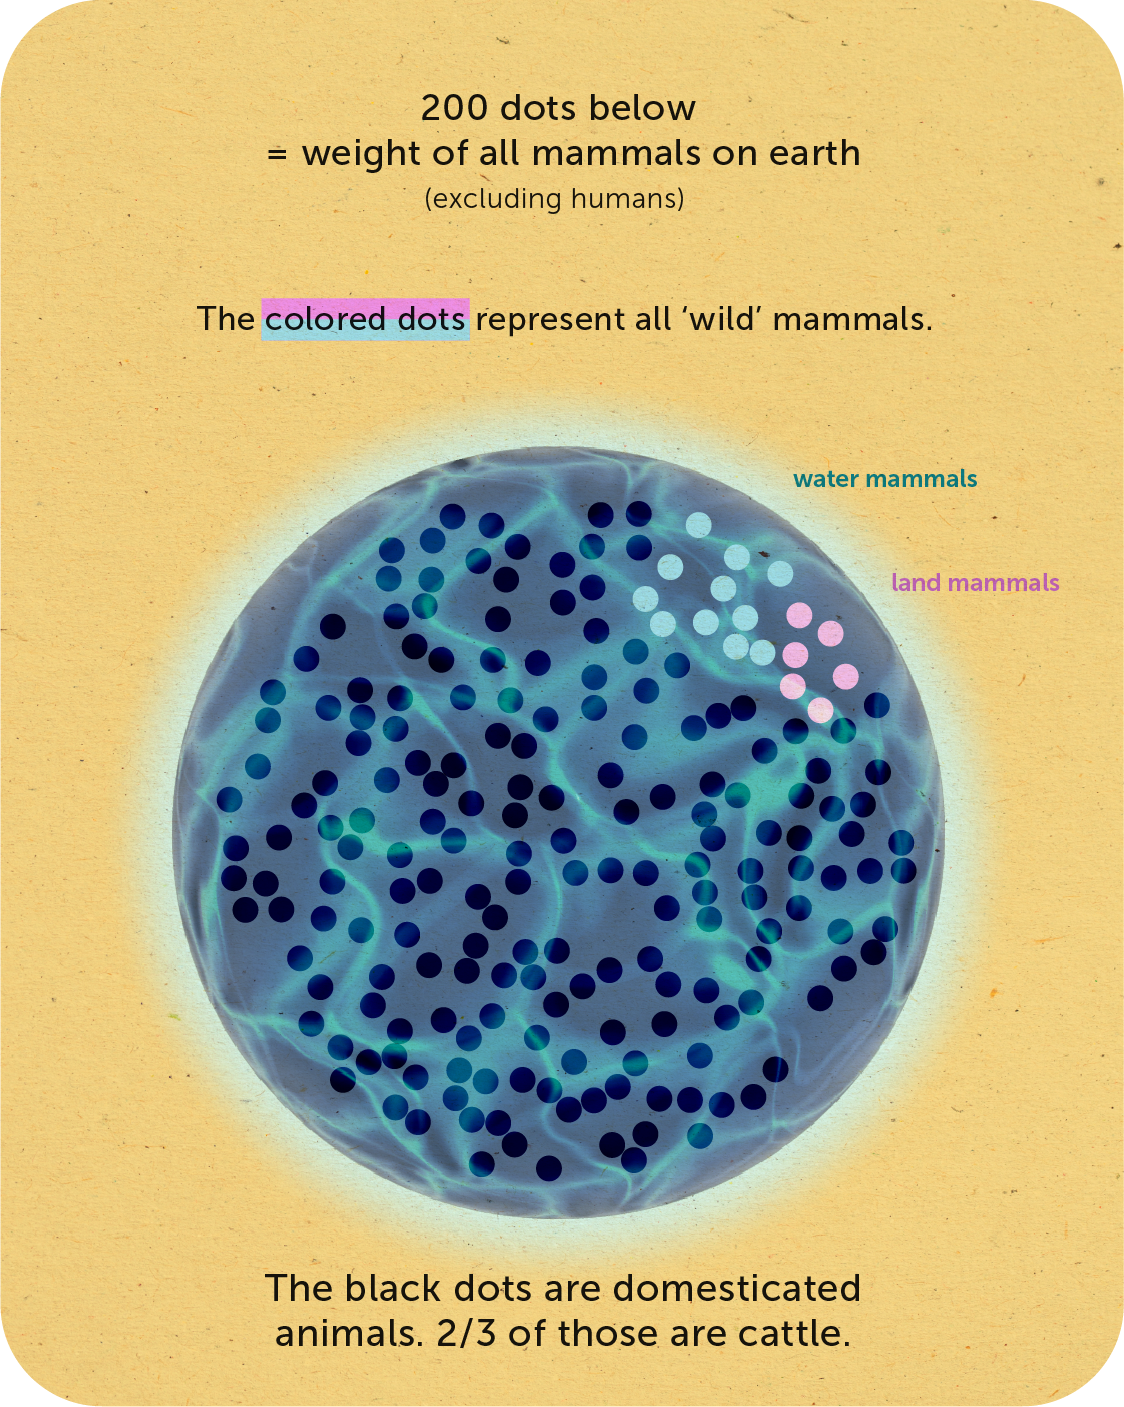
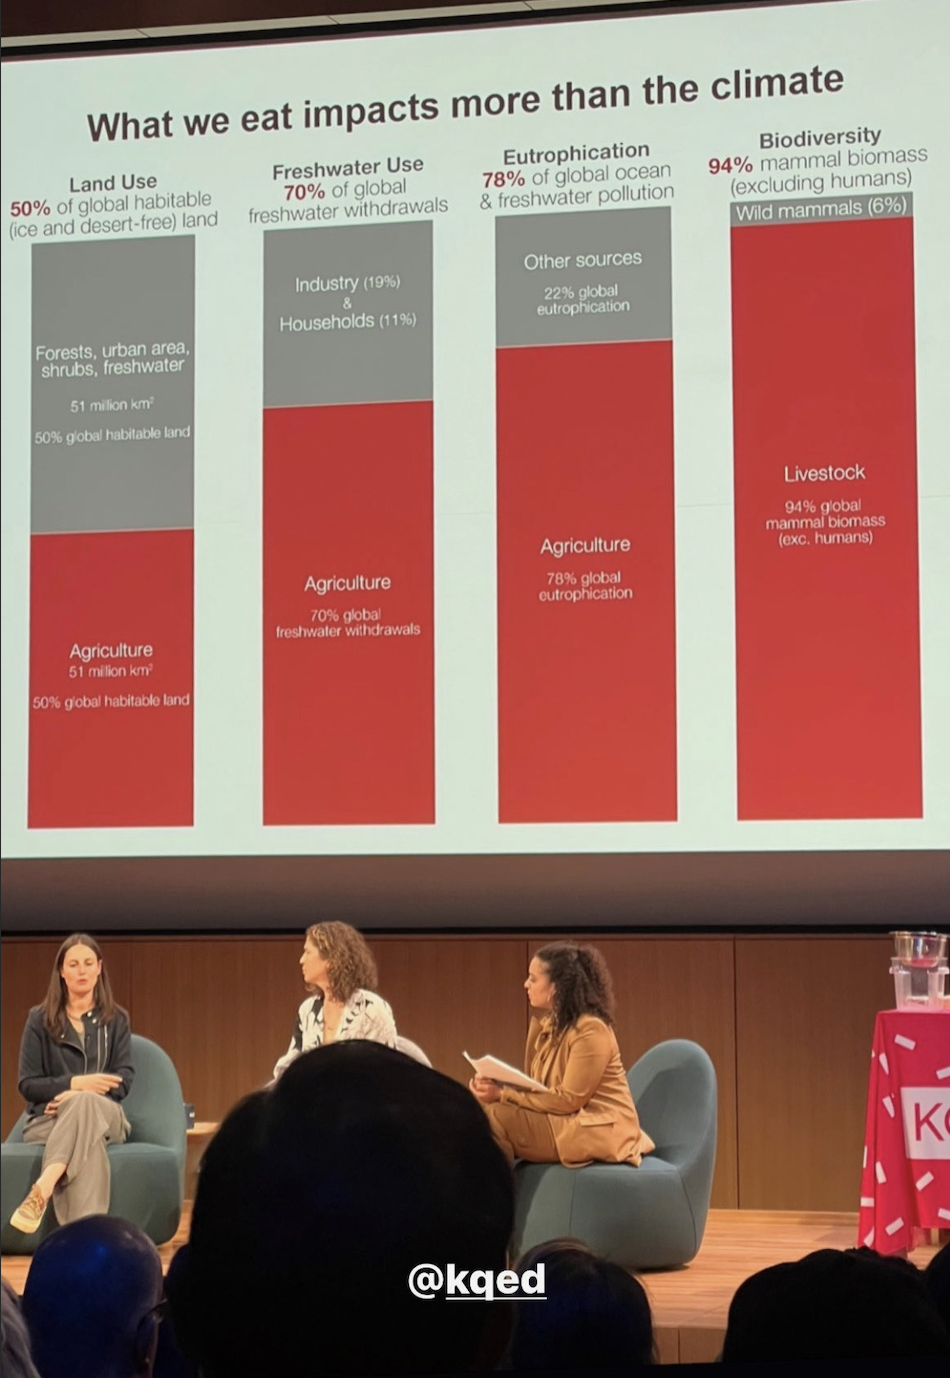
This visual was inspired by a statistic I couldn't believe at first: The vast majority of mammals that live around humans is domesticated and used for human consumption. Only a small fraction of all the mammals around humans lives a "free" or "wild" life.
Disclaimer for the graphic: I know there are a lot of words in the graphic. Please have the patience to read through it. Any suggestions on how to improve it? Leave a comment below.
More statistics on animal agriculture: The visual is rooted in a separate marble for stats on animal agriculture.
Insight on creating graphics: learned along the process that I should always add paper references to visuals that are turned into stickers.
I think the visual speaks for itself, but it is easiest to understand as an animation.
Sticker version
Animation
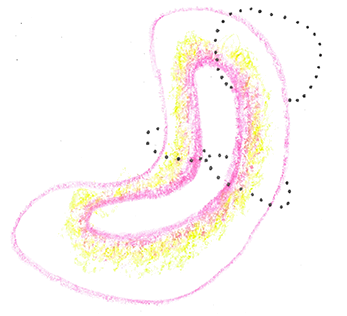
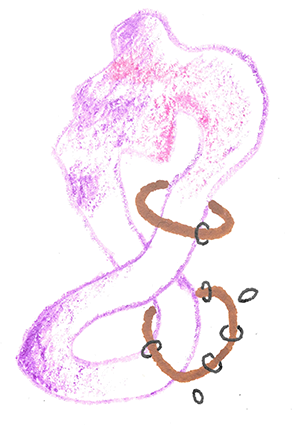
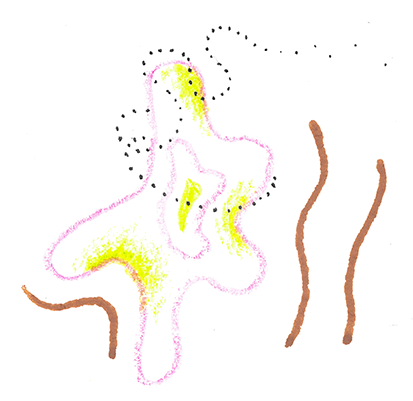
> Series of graphics for animation
>Video animation link
https://share.icloud.com/photos/0415a85X4NR6KfnPUJL4PhxrA
> Version that I made into sticker
Reference
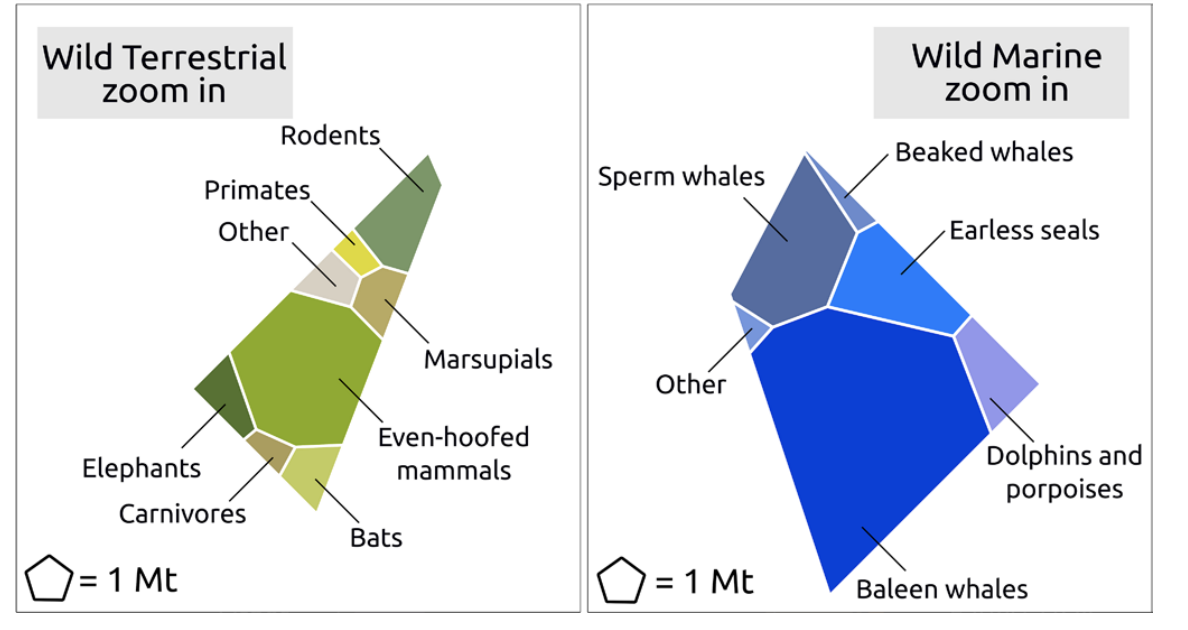
- Greenspoon et al. (2023) "The global biomass of wild mammals" published in PNAS
- Bar-On et al. (2018) "The biomass distribution on Earth" published in PNAS
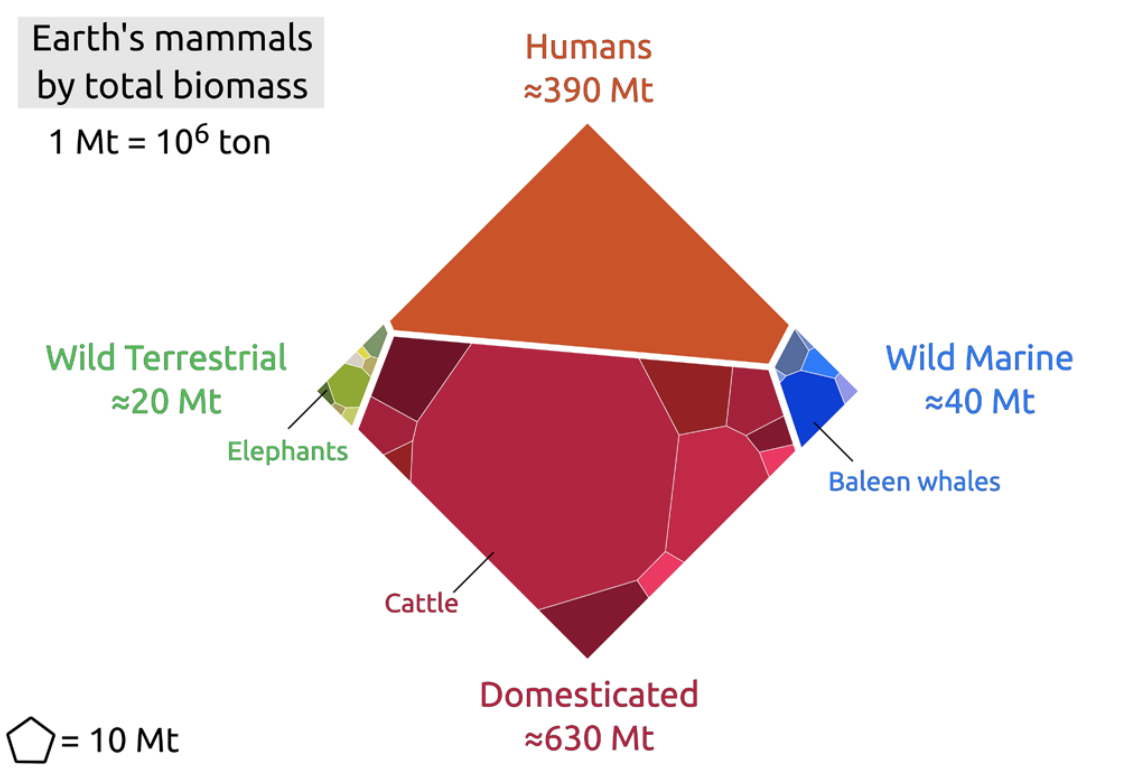
Greenspoon (2023)
Greenspoon (2023)
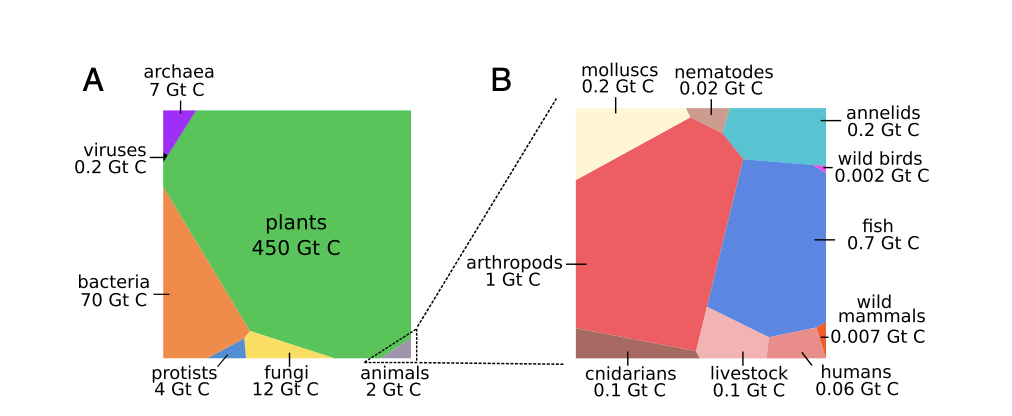
Bar-On et al. (2018)
I was originally inspired by the graphic below, but it seems to be outdated, showing higher "wild" mammal values that actually present.
#agriculture #livestock #visualization #illustration
Related Resources:
- "Eating Our Way to Extinction" is free on Youtube and in many languages and incredibly eye-opening.